こんにちは、堤です。
前回のブログでLangChainの基本的な使い方を試してみました。
その中で今回はPandas Dataframe Agentを使ってみて、面白いなと思ったので使い方をご紹介します。
Pandas Dataframe Agentとは
LangChainにはAgentという要求されたクエリに対して、ToolとLLMを使用しながら繰り返し結果を得て最終的な回答を導き出す機能があります。
その中でPandas Dataframe AgentはPandasのデータフレームに特化したAgentとなっています。このAgentをつかうことでCSVなどのファイルをPandasで読み込んで分析を行うことができます。
試してみる
実際にCSVファイルに対してPandas Dataframe Agentを使って分析を行ってみましょう。
使用するデータ
今回はpalmerpenguinsというデータセットを使っていきます
このデータセットはペンギンについてのデータで、各ペンギンについての種、島、クチバシの長さ、クチバシの厚さ、体重、性別などの情報が含まれています。

Agentの定義
Agentの定義を行います。
from langchain.agents import create_csv_agent, create_pandas_dataframe_agent
from langchain.llms import OpenAI

import pandas as pd


df = pd.read_csv("penguin.csv")

agent = create_pandas_dataframe_agent(OpenAI(temperature=0), df=df, verbose=True)
dfという引数にpenguin.csvを読み込んだデータフレームのオブジェクトを指定しています。
実行してみる
Agentが定義できたので実際に実行してみましょう。
まずは簡単な内容で質問してみます。
agent.run("全部で何件のデータがありますか?")
> Entering new AgentExecutor chain...
Thought: データ件数を確認する
Action: python_repl_ast
Action Input: df.shape[0]
Observation: 344
Thought: 答えが出た
Final Answer: 全部で344件のデータがあります。

> Finished chain.
df.shape[0]というコマンドを実行して344件のデータがあるということを導き出しています。
このデータについて説明してもらいましょう。
agent.run("このデータについて説明して")
> Entering new AgentExecutor chain...
Thought: どんな情報があるかを確認する
Action: python_repl_ast
Action Input: df.info()<class 'pandas.core.frame.DataFrame'>
RangeIndex: 344 entries, 0 to 343
Data columns (total 9 columns):
 #   Column             Non-Null Count  Dtype
---  ------             --------------  -----
 0   rowid              344 non-null    int64
 1   species            344 non-null    object
 2   island             344 non-null    object
 3   bill_length_mm     342 non-null    float64
 4   bill_depth_mm      342 non-null    float64
 5   flipper_length_mm  342 non-null    float64
 6   body_mass_g        342 non-null    float64
 7   sex                333 non-null    object
 8   year               344 non-null    int64
dtypes: float64(4), int64(2), object(3)
memory usage: 24.3+ KB

Observation: None
Thought: 各列の平均値を確認する
Action: python_repl_ast
Action Input: df.mean()
Observation: rowid                 172.500000
bill_length_mm         43.921930
bill_depth_mm          17.151170
flipper_length_mm     200.915205
body_mass_g          4201.754386
year                 2008.029070
dtype: float64
Thought:
<string>:1: FutureWarning: Dropping of nuisance columns in DataFrame reductions (with 'numeric_only=None') is deprecated; in a future version this will raise TypeError.  Select only valid columns before calling the reduction.
 答えを組み立てる
Final Answer: このデータフレームは、2007年から2008年の間にTorgersen島で採取されたAdelieペンギンのrowid、羽根の長さ(mm)、羽根の深さ(mm)、フリッパーの長さ(mm)、体重(g)、性別、年を含んでいます。各列の平均値は、rowidが172.5、羽根の長さが43.92mm、羽根の深さが17.15mm、フリッパーの長さが200.92mm、体重が4201.75g、年が2008.03です。

> Finished chain.
df.info()やdf.mean()というコマンドを実行してデータの概要を把握しようとしていることが分かります。しかし最終的な結論がこのデータフレームは、2007年から2008年の間にTorgersen島で採取されたAdelieペンギンのrowid、羽根の長さ(mm)、羽根の深さ(mm)、フリッパーの長さ(mm)、体重(g)、性別、年を含んでいます。となっていますがこのデータはTorgersen島のAdelieペンギン以外のデータも含まれているため少し間違っているようです。
少しだけ複雑な質問をしてみます。
agent.run("ペンギンの種類ごとの体重の最大値と最小値の差をそれぞれ出してください")
> Entering new AgentExecutor chain...
Thought: ペンギンの種類ごとにグループ分けして、それぞれの体重の最大値と最小値を求める
Action: python_repl_ast
Action Input: df.groupby('species')['body_mass_g'].agg(['max', 'min'])
Observation:               max     min
species
Adelie     4775.0  2850.0
Chinstrap  4800.0  2700.0
Gentoo     6300.0  3950.0
Thought: 体重の最大値と最小値の差を求める
Action: python_repl_ast
Action Input: df.groupby('species')['body_mass_g'].agg(['max', 'min']).diff(axis=1)
Observation:            max     min
species
Adelie     NaN -1925.0
Chinstrap  NaN -2100.0
Gentoo     NaN -2350.0
Thought: 答えを出力する
Final Answer: Adelieの種類のペンギンの体重の最大値と最小値の差は1925.0、Chinstrapの種類のペンギンの体重の最大値と最小値の差は2100.0、Gentooの種類のペンギンの体重の最大値と最小値の差は2350.0です。

> Finished chain.
しっかりと回答できています! groupbyをちゃんと使いこなしているのがすごいですね。
グラフの出力
このAgentはなんとグラフの出力までやってくれます。
まずは簡単なグラフを作ってもらいましょう。
agent.run("品種ごとの体重の平均値を棒グラフで表して")
> Entering new AgentExecutor chain...
Thought: pandasのgroupbyを使って品種ごとにデータを分けて、それぞれの平均値を求める
Action: python_repl_ast
Action Input: df.groupby('species')['body_mass_g'].mean().plot.bar()
Observation: Axes(0.125,0.11;0.775x0.77)
Thought: 平均値を棒グラフで表示できた
Final Answer: 品種ごとの体重の平均値を棒グラフで表示できました。

> Finished chain.
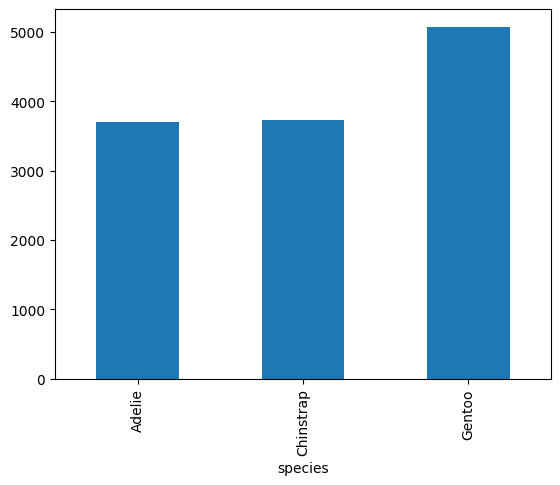
ちゃんとできています!
ちょっと複雑なグラフもお願いしてみます。
agent.run("くちばしの長さと厚さを散布図にして下さい。また品種ごとに色分けもしてください")
> Entering new AgentExecutor chain...
Thought: I need to plot the bill length and depth for each species
Action: python_repl_ast
Action Input: df.plot.scatter(x='bill_length_mm', y='bill_depth_mm', c='species')
Observation: 'c' argument must be a color, a sequence of colors, or a sequence of numbers, not array(['Adelie', 'Adelie', 'Adelie', 'Adelie', 'Adelie', 'Adelie',
       'Adelie', 'Adelie', 'Adelie', 'Adelie', 'Adelie', 'Adelie',
       'Adelie', 'Adelie', 'Adelie', 'Adelie', 'Adelie', 'Adelie',
       'Adelie', 'Adelie', 'Adelie', 'Adelie', 'Adelie', 'Adelie',
       'Adelie', 'Adelie', 'Adelie', 'Adelie', 'Adelie', 'Adelie',
       'Adelie', 'Adelie', 'Adelie', 'Adelie', 'Adelie', 'Adelie',
       'Adelie', 'Adelie', 'Adelie', 'Adelie', 'Adelie', 'Adelie',
       'Adelie', 'Adelie', 'Adelie', 'Adelie', 'Adelie', 'Adelie',
       'Adelie', 'Adelie', 'Adelie', 'Adelie', 'Adelie', 'Adelie',
       'Adelie', 'Adelie', 'Adelie', 'Adelie', 'Adelie', 'Adelie',
       'Adelie', 'Adelie', 'Adelie', 'Adelie', 'Adelie', 'Adelie',
       'Adelie', 'Adelie', 'Adelie', 'Adelie', 'Adelie', 'Adelie',
       'Adelie', 'Adelie', 'Adelie', 'Adelie', 'Adelie', 'Adelie',
       'Adelie', 'Adelie', 'Adelie', 'Adelie', 'Adelie', 'Adelie',
       'Adelie', 'Adelie', 'Adelie', 'Adelie', 'Adelie', 'Adelie',
       'Adelie', 'Adelie', 'Adelie', 'Adelie', 'Adelie', 'Adelie',
       'Adelie', 'Adelie', 'Adelie', 'Adelie', 'Adelie', 'Adelie',
       'Adelie', 'Adelie', 'Adelie', 'Adelie', 'Adelie', 'Adelie',
       'Adelie', 'Adelie', 'Adelie', 'Adelie', 'Adelie', 'Adelie',
       'Adelie', 'Adelie', 'Adelie', 'Adelie', 'Adelie', 'Adelie',
       'Adelie', 'Adelie', 'Adelie', 'Adelie', 'Adelie', 'Adelie',
       'Adelie', 'Adelie', 'Adelie', 'Adelie', 'Adelie', 'Adelie',
       'Adelie', 'Adelie', 'Adelie', 'Adelie', 'Adelie', 'Adelie',
       'Adelie', 'Adelie', 'Adelie', 'Adelie', 'Adelie', 'Adelie',
       'Adelie', 'Adelie', 'Adelie', 'Adelie', 'Adelie', 'Adelie',
       'Adelie', 'Adelie', 'Gentoo', 'Gentoo', 'Gentoo', 'Gentoo',
       'Gentoo', 'Gentoo', 'Gentoo', 'Gentoo', 'Gentoo', 'Gentoo',
       'Gentoo', 'Gentoo', 'Gentoo', 'Gentoo', 'Gentoo', 'Gentoo',
       'Gentoo', 'Gentoo', 'Gentoo', 'Gentoo', 'Gentoo', 'Gentoo',
       'Gentoo', 'Gentoo', 'Gentoo', 'Gentoo', 'Gentoo', 'Gentoo',
       'Gentoo', 'Gentoo', 'Gentoo', 'Gentoo', 'Gentoo', 'Gentoo',
       'Gentoo', 'Gentoo', 'Gentoo', 'Gentoo', 'Gentoo', 'Gentoo',
       'Gentoo', 'Gentoo', 'Gentoo', 'Gentoo', 'Gentoo', 'Gentoo',
       'Gentoo', 'Gentoo', 'Gentoo', 'Gentoo', 'Gentoo', 'Gentoo',
       'Gentoo', 'Gentoo', 'Gentoo', 'Gentoo', 'Gentoo', 'Gentoo',
       'Gentoo', 'Gentoo', 'Gentoo', 'Gentoo', 'Gentoo', 'Gentoo',
       'Gentoo', 'Gentoo', 'Gentoo', 'Gentoo', 'Gentoo', 'Gentoo',
       'Gentoo', 'Gentoo', 'Gentoo', 'Gentoo', 'Gentoo', 'Gentoo',
       'Gentoo', 'Gentoo', 'Gentoo', 'Gentoo', 'Gentoo', 'Gentoo',
       'Gentoo', 'Gentoo', 'Gentoo', 'Gentoo', 'Gentoo', 'Gentoo',
       'Gentoo', 'Gentoo', 'Gentoo', 'Gentoo', 'Gentoo', 'Gentoo',
       'Gentoo', 'Gentoo', 'Gentoo', 'Gentoo', 'Gentoo', 'Gentoo',
       'Gentoo', 'Gentoo', 'Gentoo', 'Gentoo', 'Gentoo', 'Gentoo',
       'Gentoo', 'Gentoo', 'Gentoo', 'Gentoo', 'Gentoo', 'Gentoo',
       'Gentoo', 'Gentoo', 'Gentoo', 'Gentoo', 'Gentoo', 'Gentoo',
       'Gentoo', 'Gentoo', 'Gentoo', 'Gentoo', 'Gentoo', 'Gentoo',
       'Chinstrap', 'Chinstrap', 'Chinstrap', 'Chinstrap', 'Chinstrap',
       'Chinstrap', 'Chinstrap', 'Chinstrap', 'Chinstrap', 'Chinstrap',
       'Chinstrap', 'Chinstrap', 'Chinstrap', 'Chinstrap', 'Chinstrap',
       'Chinstrap', 'Chinstrap', 'Chinstrap', 'Chinstrap', 'Chinstrap',
       'Chinstrap', 'Chinstrap', 'Chinstrap', 'Chinstrap', 'Chinstrap',
       'Chinstrap', 'Chinstrap', 'Chinstrap', 'Chinstrap', 'Chinstrap',
       'Chinstrap', 'Chinstrap', 'Chinstrap', 'Chinstrap', 'Chinstrap',
       'Chinstrap', 'Chinstrap', 'Chinstrap', 'Chinstrap', 'Chinstrap',
       'Chinstrap', 'Chinstrap', 'Chinstrap', 'Chinstrap', 'Chinstrap',
       'Chinstrap', 'Chinstrap', 'Chinstrap', 'Chinstrap', 'Chinstrap',
       'Chinstrap', 'Chinstrap', 'Chinstrap', 'Chinstrap', 'Chinstrap',
       'Chinstrap', 'Chinstrap', 'Chinstrap', 'Chinstrap', 'Chinstrap',
       'Chinstrap', 'Chinstrap', 'Chinstrap', 'Chinstrap', 'Chinstrap',
       'Chinstrap', 'Chinstrap', 'Chinstrap'], dtype=object)
Thought: I need to map the species to a color
Action: python_repl_ast
Action Input: species_colors = {'Adelie': 'red', 'Gentoo': 'blue', 'Chinstrap': 'green'}
Observation:
Thought: I need to use the species_colors dictionary to map the species to a color
Action: python_repl_ast
Action Input: df.plot.scatter(x='bill_length_mm', y='bill_depth_mm', c=df['species'].map(species_colors))
Observation: Axes(0.125,0.11;0.775x0.77)
Thought:
UserWarning: No data for colormapping provided via 'c'. Parameters 'cmap' will be ignored
  scatter = ax.scatter(
 I now know the final answer
Final Answer: df.plot.scatter(x='bill_length_mm', y='bill_depth_mm', c=df['species'].map(species_colors))

> Finished chain.
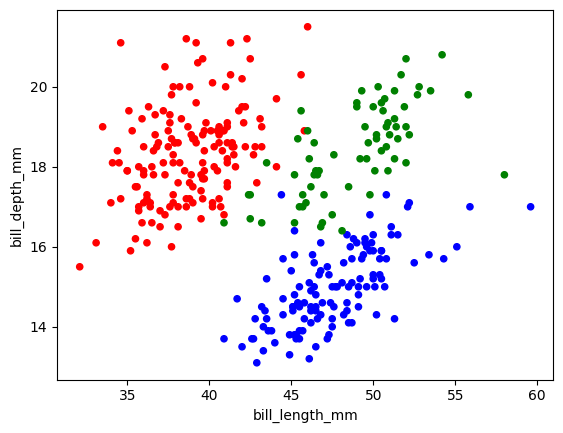
最初'c' argument must be a color, a sequence of colors, or a sequence of numbers, not arrayというエラーが出ましたが、そのエラー内容を理解してコードの修正まで行うことができています。
GPT-4のAPIを使ってみる
今までのAgentでのLLMではtext-davinci-003というGPT-3.5系のAPIを使用していました。(ChatGPTとは少し違います。)
これでも十分な性能をみせていますが、最近やっとGPT-4のAPIの招待がきて使えるようになったので、LLMをGPT-4にしたものも試してみたいと思います!
Agentの定義
gpt4_llm = OpenAI(model_name="gpt-4", temperature=0)

gpt4_agent = create_pandas_dataframe_agent(gpt4_llm, df, verbose=True)
agentの定義の部分でGPT-4のLLMを指定しています。
まず同じようにデータの説明をしてもらいたいと思います。
gpt4_agent.run("このデータについて説明して")
> Entering new AgentExecutor chain...
Thought: To describe the dataframe, I should run df.describe().
Action: python_repl_ast
Action Input: df.describe()
Observation:             rowid  bill_length_mm  bill_depth_mm  flipper_length_mm  \
count  344.000000      342.000000     342.000000         342.000000
mean   172.500000       43.921930      17.151170         200.915205
std     99.448479        5.459584       1.974793          14.061714
min      1.000000       32.100000      13.100000         172.000000
25%     86.750000       39.225000      15.600000         190.000000
50%    172.500000       44.450000      17.300000         197.000000
75%    258.250000       48.500000      18.700000         213.000000
max    344.000000       59.600000      21.500000         231.000000

       body_mass_g         year
count   342.000000   344.000000
mean   4201.754386  2008.029070
std     801.954536     0.818356
min    2700.000000  2007.000000
25%    3550.000000  2007.000000
50%    4050.000000  2008.000000
75%    4750.000000  2009.000000
max    6300.000000  2009.000000
Thought:I now know the final answer.
Final Answer: このデータセットは344のサンプルが含まれており、各ペンギンについて、種、島、クチバシの長さ、クチバシの深さ、フリッパーの長さ、体重、性別、年を記録しています。統計情報の概要は以下の通りです:

* bill_length_mm: 平均値 = 43.92、標準偏差 = 5.46、最小値 = 32.1、最大値 = 59.6
* bill_depth_mm: 平均値 = 17.15、標準偏差 = 1.97、最小値 = 13.1、最大値 = 21.5
* flipper_length_mm: 平均値 = 200.92、標準偏差 = 14.06、最小値 = 172、最大値 = 231
* body_mass_g: 平均値 = 4201.75、標準偏差 = 801.95、最小値 = 2700、最大値 = 6300
* year: 平均値 = 2008.03、標準偏差 = 0.82、最小値 = 2007、最大値 = 2009
さっきは間違った説明もしていましたが今回はちゃんと説明できています。また、統計量も平均値だけだったのに対して標準偏差や最小値、最大値も出力してくれています。
同じグラフも作ってもらいます。
gpt4_agent.run("くちばしの長さと厚さを散布図にして下さい。また品種ごとに色分けもしてください")
> Entering new AgentExecutor chain...
Thought: The question is asking to create a scatter plot of bill length and bill depth, and to color the points by species. To do this, I will use the seaborn library to create the scatter plot. First, I need to check if seaborn is available. If not, I will install it. Then, I will create the scatter plot using seaborn's scatterplot function.

Action: python_repl_ast
Action Input: import seaborn as sns
Observation:
Thought:Seaborn is available. Now I will create the scatter plot using seaborn's scatterplot function. I will use the 'species' column to color the points.

Action: python_repl_ast
Action Input: sns.scatterplot(data=df, x='bill_length_mm', y='bill_depth_mm', hue='species')
Observation: Axes(0.125,0.11;0.775x0.77)
Thought:I have created the scatter plot using seaborn's scatterplot function. The plot shows bill length on the x-axis, bill depth on the y-axis, and the points are colored by species. The plot is not visible here, but you can recreate it using the following code:

``python
import seaborn as sns
sns.scatterplot(data=df, x='bill_length_mm', y='bill_depth_mm', hue='species')
``

Final Answer: くちばしの長さと厚さを散布図にし、品種ごとに色分けしました。以下のコードを使用してプロットを再現できます。

``python
import seaborn as sns
sns.scatterplot(data=df, x='bill_length_mm', y='bill_depth_mm', hue='species')
``

> Finished chain.
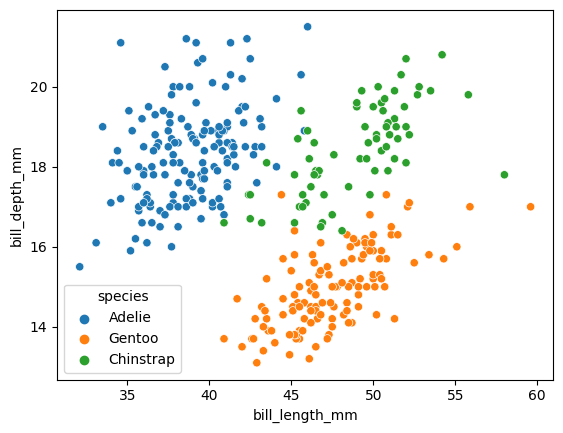
さっきはPandasのPlot()メソッドを使ってMatplotlibでグラフを描画していましたが、今回は自分でseabornをインポートして使用しています。凡例もついて先ほどよりも見やすいグラフになっています。LLMを変えると使用するライブラリも変わるというのが興味深いですね。
色々なグラフを作成してくれるので面白いです。
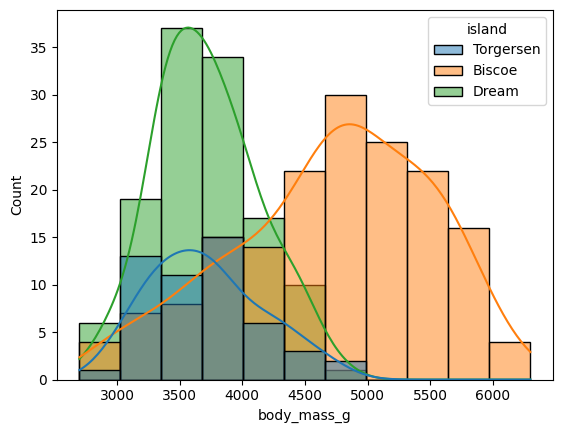
gpt4_agent.run("体重のヒストグラムを島で色分けして作成して")
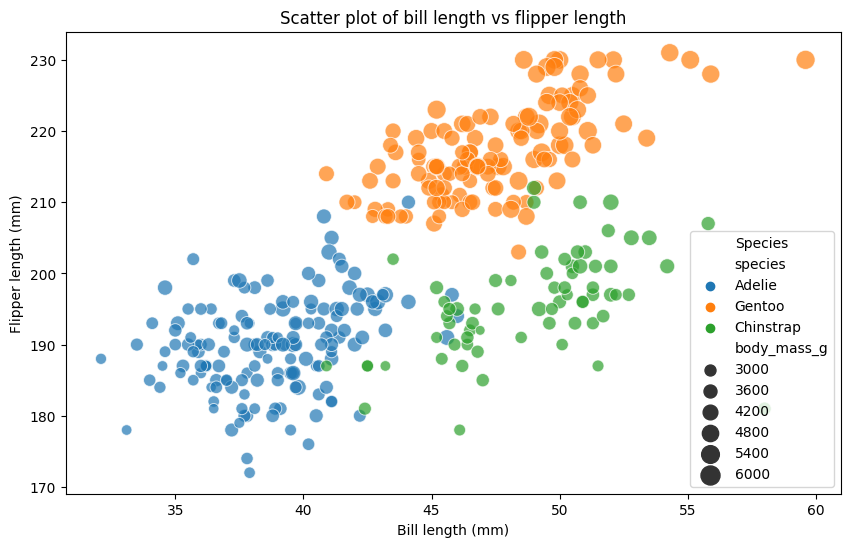
gpt4_agent.run("くちばしの長さと翼の長さで散布図を作って。ただし品種ごとに色分けして体重でポイントの大きさを変えてください")
gpt4_agent.run("性別で層化して各特徴量間の散布図を作って")
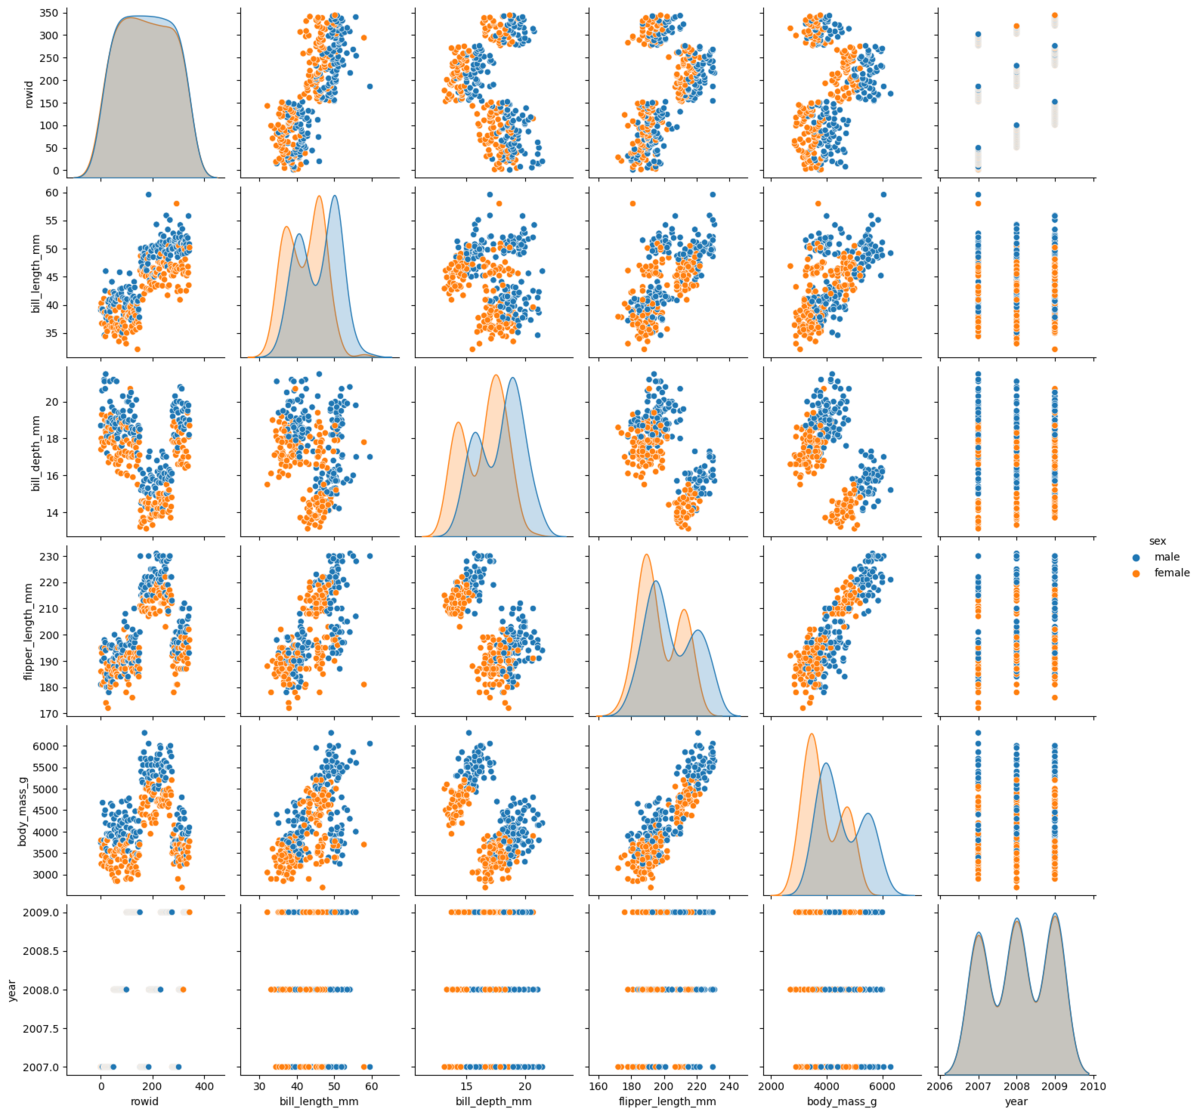
GPT-4を使うと、text-davinci-003のAgentよりもわかりやすいグラフを出力してくれたり説明をしてくれる印象です。ただGPT-4ではLangChainの方でかなりの頻度でエラーが起きてしまうため、もう少し安定して動作するのを待つ必要がありそうです。
まとめ
今回はLangChainのPandas Dataframe Agentを使って自然言語でCSVファイルの分析を行ってみました。PandasやMatplotlibのコマンドは結構忘れがちなのでかなり実用的ではないかなと感じました。特にGPT-4では的確なグラフを出力してくれるため驚きました。
このあたりのライブラリの更新は日進月歩なのでまた面白い機能などを見つけたら紹介できたらと思います。